KPIs
You can use KPIs to rate the success of your marketing measures.You set up KPIs under > Planner > Settings > KPIs.
You can create three types of KPIs in the Planner:
-
Measurement: This value is entered by the user.
-
Computed: This value is calculated using the formula that has been defined.
-
Constant: The value is preset for the KPI. A constant KPI cannot be added to an element; instead, it is used to calculate other KPIs. In the default setting, the following constants from budget planning can already be used: Planned, Target, Committed, Actual, Projected budget, Residual budget and MDF. The values refer to the element for which the KPI is calculated.
|
Name |
Description |
|---|---|
|
Name |
Define the name with which the KPI is displayed in the detailed view. |
|
Information concerning weight, target or statement |
Provide users with assistance by describing how they should process the KPI. |
|
Required |
You can define whether the KPI has to be used for each element of the tree structure. You can only flag the Calculated and Measurement types. Note: Note that a KPI cannot be archived and a mandatory KPI at the same time. |
|
Archived |
This determines whether the KPI is to be archived. You can only archive the Computed and Measurement types. Note: Note that a KPI cannot be archived and a mandatory KPI at the same time. |
|
KPI Sets |
You assign the KPI to a set. You can group several KPIs together to form a KPI set. When you assign a KPI set to a planning activity, you assign the entire KPI group along with it. Create a set by entering a set name in the input field and pressing Enter. To assign a KPI to an existing set, select the relevant entry from the dropdown list. |
|
Type |
Note: The KPI type can only be changed if the KPI has not been used on a planning activity. You set the type of the KPI. |
|
Formula |
Note: This is visible only if the Type = Computed. Define the formula that is used to calculate the KPI value for the Computed type. You can use the following characters for the calculation operations:
You can use created KPIs or system KPIs for the formula. System KPIs correspond to the Planned, Target, Committed, Actual, Projected, Remaining and MDF columns. The system KPIs are calculated as a total of the values from the years for which the KPI is calculated. |
|
Analysis Type |
You can define how the values stored for the status borders are interpreted in relation to the traffic light control system.
|
|
With the status limits you define the percentage values for the traffic light control. Between the status borders, there is always the yellow area of the traffic light. Outside the status borders, the color of the traffic light depends on the setting in the property type of the analysis:
The values between your entries are flagged with a yellow traffic light. You can adjust the status borders individually for each created KPI. If you click Apply global value, you copy the value that you entered under > Planner > Settings > KPIs. Note: Note that this does not establish a permanent link between the global value and the status borders of this KPIs: If you change the global value at a later stage, the individual status borders of the KPI are not changed. |
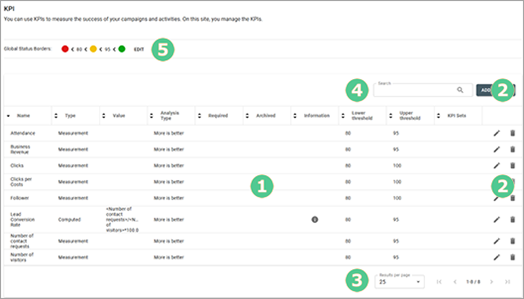
The table displays all KPIs that have already been created (❶). You can use the , Edit, and Delete buttons to edit the overall status ( ❷). Use the dropdown list on the right below the table to set how many KPIs are displayed per screen (❸). Use the arrow keys to navigate through a table with multiple screens.
If you have an extensive number of KPIs, you can carry out a full-text search in the search fields above the table using the KPI names (❹). The table displays the search result.
You enter the global value for the status borders above the table navigation (❺). You can define the percentages for the traffic light control system:
-
The percentage value below which the red light is triggered
-
The percentage value at which the green light is triggered
The values between your entries are flagged with a yellow traffic light. You can adjust the status borders individually for each created KPI.
The global value is used at two points:
-
When you create a KPI, you can apply the global value for the status borders of this KPI.
Note: Note that this does not set up a permanent link between the global value and the status borders of this KPIs: If you change the global value at a later stage, the individual status borders of the KPI are not changed.
-
In the detailed view of an element, the total results achieved for all of the KPIs of the element are displayed on the KPIs tab below the table. The global value for status borders are used for the color display of the target achieved.
To adapt the table to your requirements, you have the following options. The settings are saved for each user and can be adjusted again at any time.
-
Column width: Change the column width in the same way as in spreadsheet programs.
-
Sorting the displayed objects: To change the sorting, move the cursor to the header line of the table in the column to be used for the sorting. An arrow is displayed on the right-hand side of the cell. Click the arrow and choose and .